
Background
The Discovery Park Navigation Study was conducted for a user research course in the Human Centered Design and Engineering department at the University of Washington. The overall focus of this research was to understand how people navigate while walking the trails at Seattle’s Discovery Park. As an avid park visitor, I was interested in how others successfully plan and execute a day walking in the park. Discovery Park is Seattle’s largest park, boasting 11.81 miles of trails on 534 acres of land. During my own visits to Discovery Park, I often felt disoriented while negotiating the trails. My past experiences navigating the park were my main motivation for this research.
Project Type
Individual project
Project Components
Study plans, field observations, interview protocol, interview recruitment, interviews, survey protocol, survey recruitment, qualitative and quantitative analysis, reports, and project presentation
Timeline
March - June 2017 (10 weeks)
overview
This research was separated into three components, each utilizing a different methodology: field observations, phone interviews, and surveys. These components built off of each other, helping me to successfully achieve my three main research goals:
- Understand the issues that occur while walking the trails
- Identify the pain points associated with using navigation tools
- Make recommendations to improve existing navigation tools or create new ones
Complete Report
The information provided on this page is a heavily summarized version of the project. The complete and extensive research report is available below.

target user
Non-experts, people who do not consider themselves very familiar with the trails in the park. The reason for excluding people who are too familiar with the trails was that they would likely have their routes memorized and, therefore, would not need to use navigation tools.
Field study
My research began with a field study at Discovery Park. By observing people from a distance, I was able to identify potential navigation pain points and the different tactics people employed to deal with these issues. My observations left me with a number of unanswered questions of why the navigation tools, trail markers and maps, provided by the park were seemingly inadequate. These unanswered questions formed the foundation for my interview and survey studies that followed.

Locations
1. Hidden Valley, Loop, & North Beach Trails

This location allowed me to view multiple trails and observe how people negotiate one of the park's most complicated intersections.
2. Environmental Learning Center (Visitor Center)

The visitor center was an ideal place to observe people preparing for their walk in the park and gave me the opportunity to observe people retrieving park maps and asking for directions.
Notes and Analysis
Each observation session was recorded using handwritten notes. After the sessions were completed, all notes were cleaned-up and transferred to digital form. The field notes were coded by categories then analyzed using an affinity analysis in order to surface major themes and ideas.
The major theme that emerged from my analysis was people's use of navigation tools while walking in the park.
Key Findings
Missing Trail Markers: The absence of trail markers at the intersection of the Hidden Valley, Loop, and North Beach trails caused people to exhibit uncertainty.
Existing Trail Markers: Three of the existing trail markers at the intersection of the Hidden Valley, Loop, and North Beach trails are clustered around one intersection. These trail markers caused confusion and often required people to rely on additional tools (including a different trail marker) to reorient themselves.
Way-Finding Map: The paper way-finding map supplied by the park was an insufficient tool for providing clear direction. The map caused uncertainty and often required additional tools to determine the desired direction of travel.
Interview study
The second step in my research was an interview study which aimed to better understand the behaviors observed in my field study. In addition to clarifying my observations, I wanted to find out how people plan their routes in the park and what tools they use most and why. Using a semi-structured interview method gave me the flexibility to ask impromptu questions that uncovered details that would have been impossible to observe in the field.
notes and analysis
Each interview session was recorded in two ways: handwritten notes and audio recording. After conducting the interviews, key elements of the audio recordings were transcribed. The transcriptions were analyzed by highlighting items of interest, coding keywords, and organizing into themes using thematic analysis.

Key Findings
Missing Tools: Missing static tools within the park are the leading cause for disorientation on the trails. This includes missing trail markers at key decision points and a lack of posted maps within park.
Trail Choice: While preparing for their walk in the park, some people use a single-trail method to choose their route. The single-trail method is when people choose a specific trail to mitigate navigation decisions and simplify their walk.
People: People are an important fail-safe navigation tool. When faced with confusion, people rely on others' knowledge to help navigate the trails.
Survey study
Finally, my research concluded with a survey study to further validate the findings from my two earlier studies. My survey questions focused on people’s experiences using the park’s tools and whether the tools contribute to disorientation on the trails. The mostly quantitative data I collected in the survey gave me the chance to create telling visuals that provided important insights when discussing the study's results. These insights proved invaluable when considering my final design recommendations.
Survey
Participants were recruited for the survey by emailing an electronic flyer and posting a paper flyer to the community cork board in the park’s visitor center. All surveys were administered online using Google Forms.


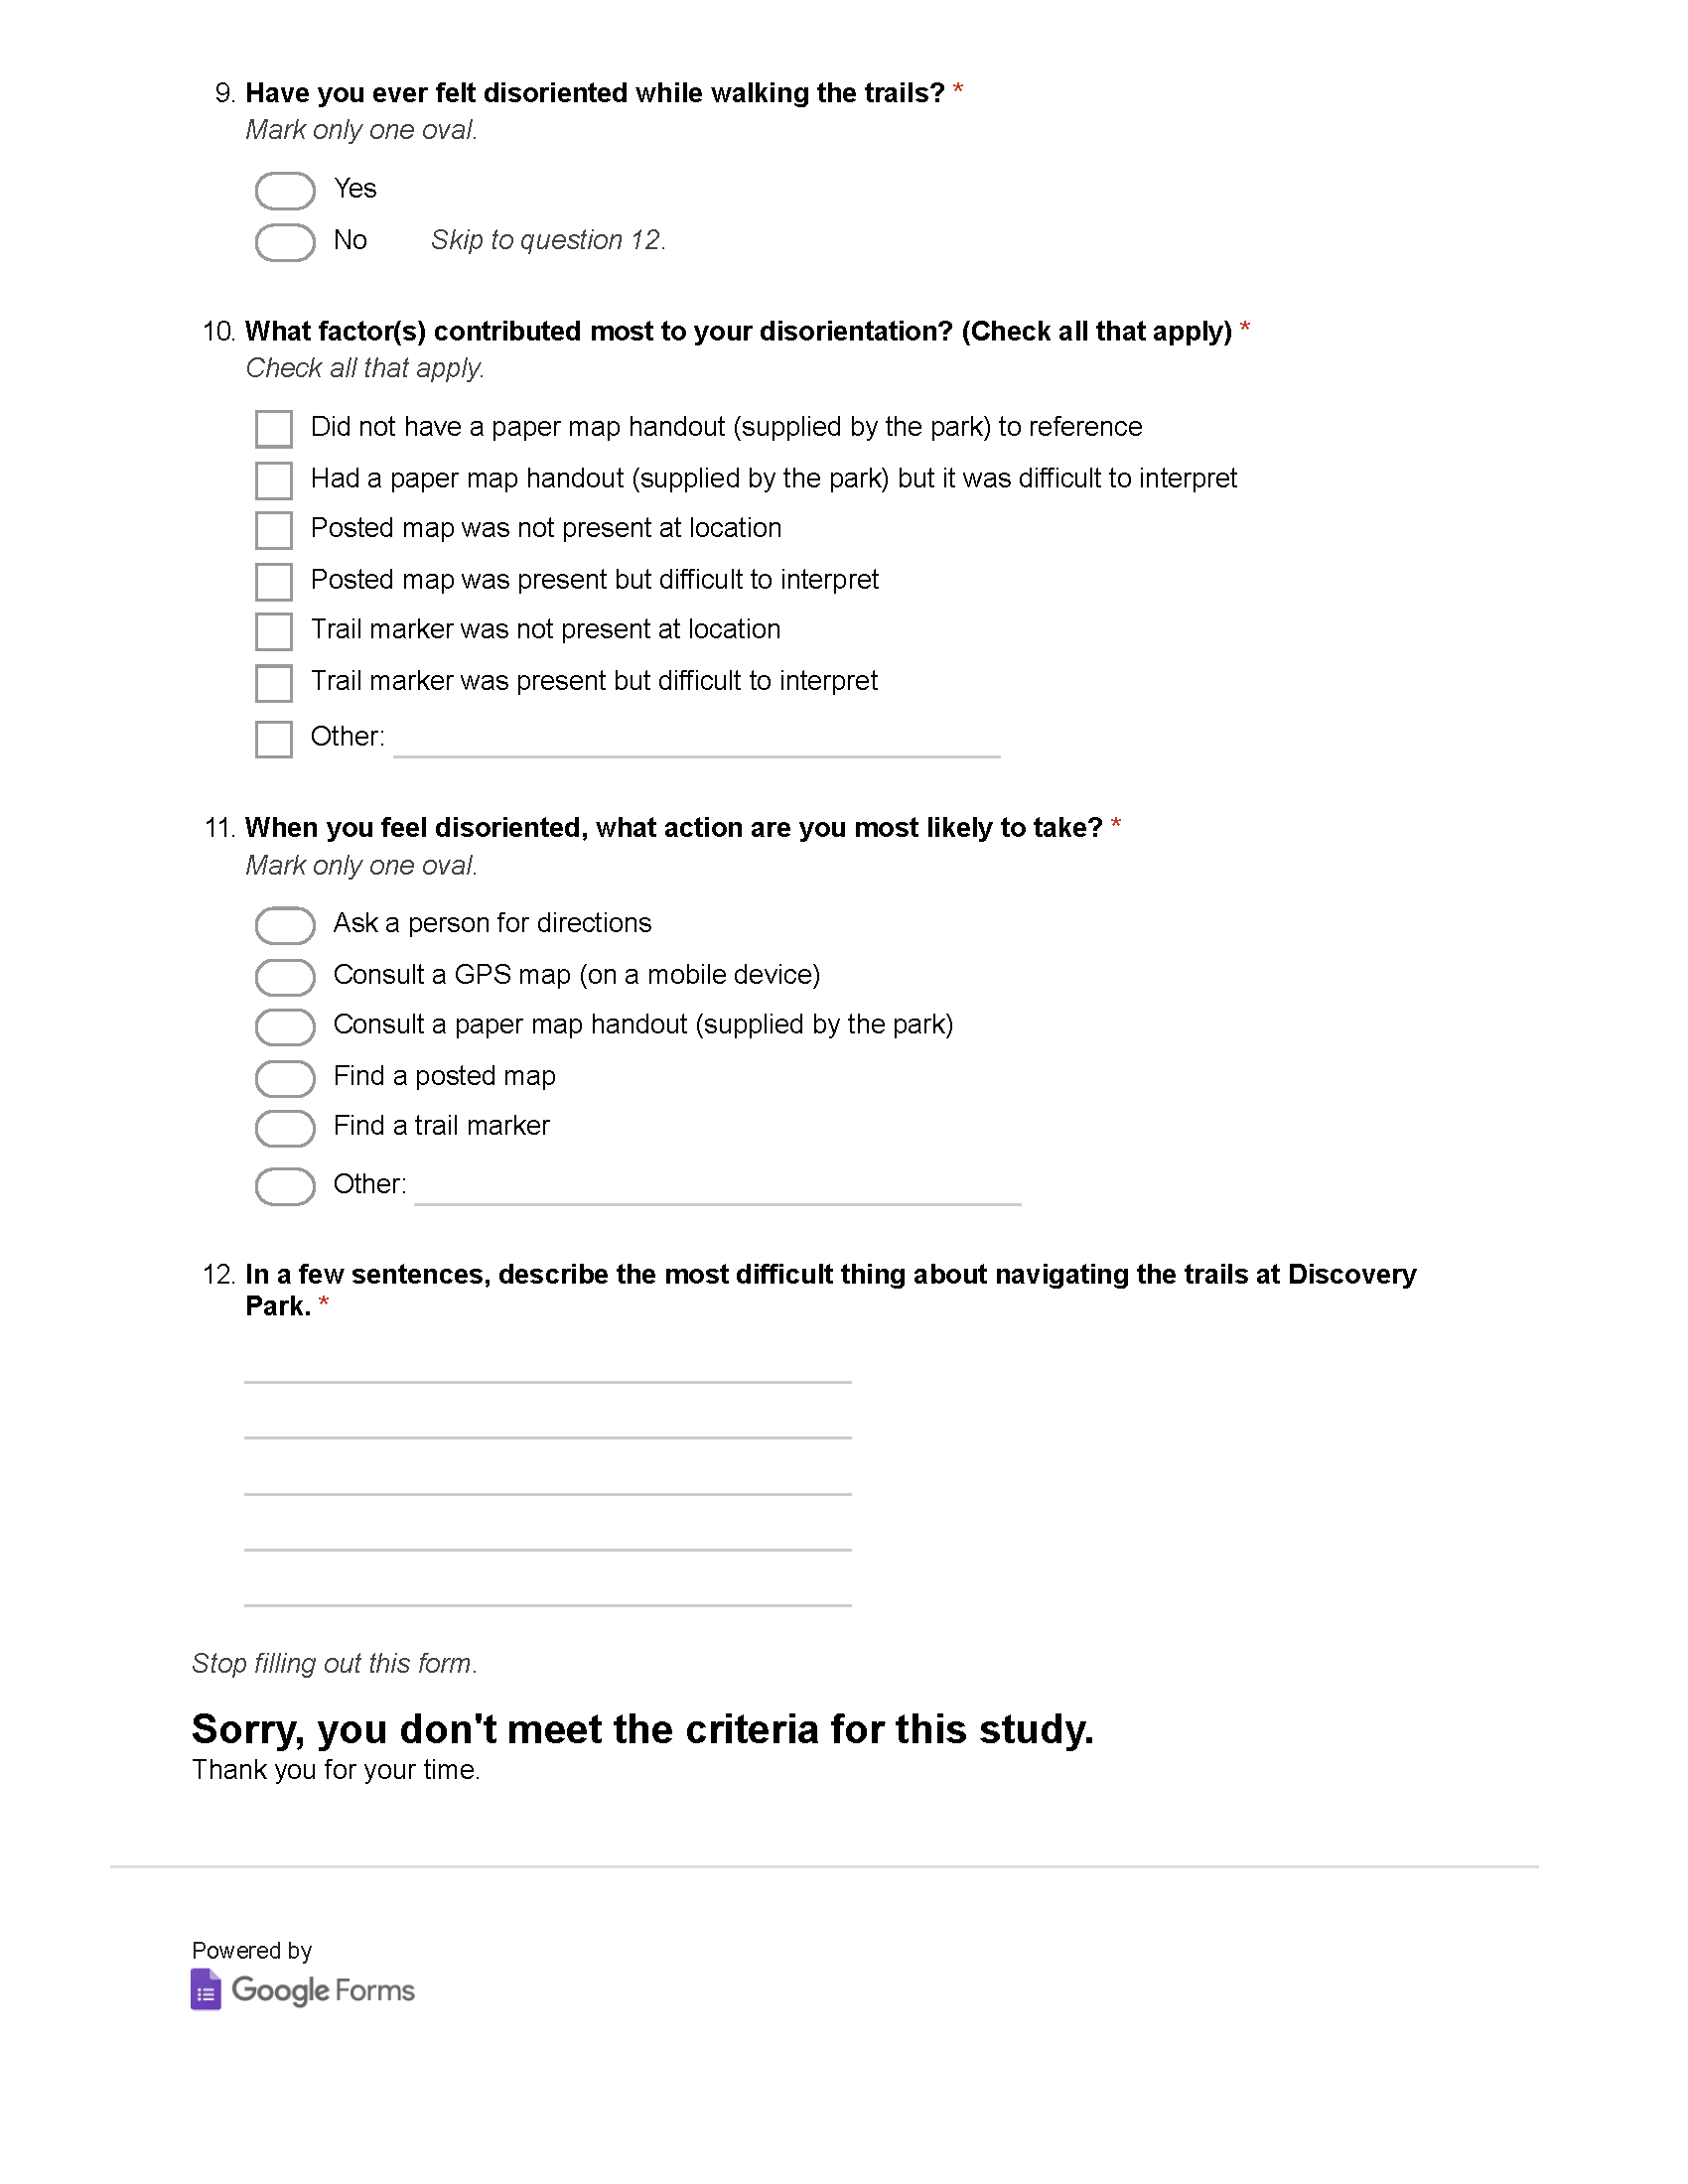
The survey consisted of a wide variety of questions types: checklist, multiple choice, ranking, rating, and open ended.
Notes and Analysis
Once the survey period ended, all collected data was exported into a spreadsheet for analysis. Next, all open ended questions were analyzed by highlighting keywords and creating codes to unify the data. Finally, I create frequency graphs for each question and began comparing data from the entire survey, looking for interesting trends.
key Findings
Tool Reliance: People who use navigation tools to negotiate the park’s trails, rely mostly on the park’s static tools: trail markers and posted maps.
Tool Difficulty: People do not find it difficult to use the park’s paper way-finding map (supplied by the park), posted maps, and trail markers.
Tool Availability: The availability of trail markers and posted maps vary within the park’s trail network. Trail markers are shown to be quite prevalent throughout the park but posted maps are missing in some locations.
Disoriented Behavior: The majority of people have experienced disorientation while navigating the trails. The main cause for this confusion is related to trail markers not being present or being difficult to interpret.
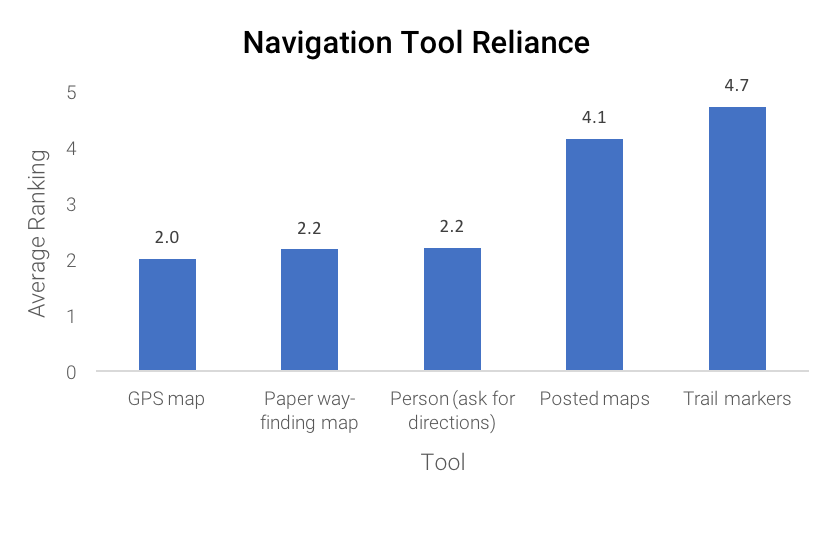
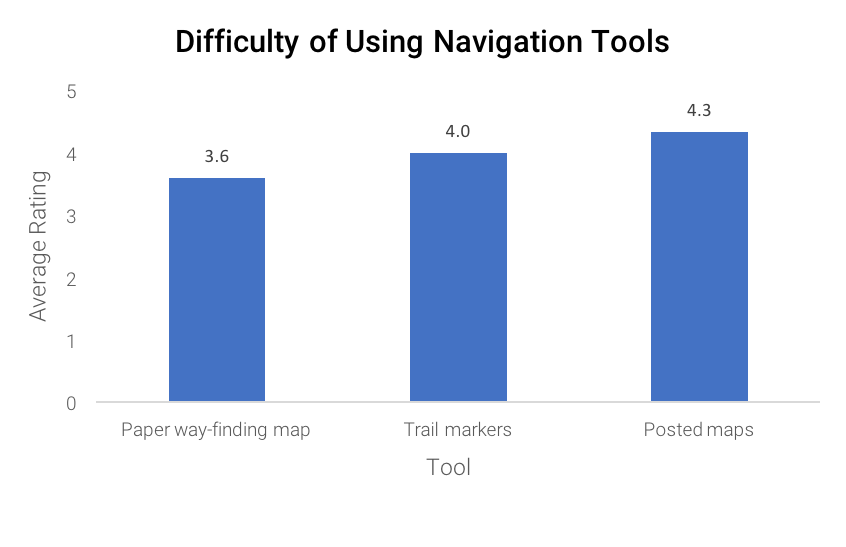


Data visualizations created from the survey results were a useful tool when formulating my key findings.
DESIGN recommendations
After analyzing the entirety of my research, I concluded that there were three key design recommendations that could improve people's experience while walking the park's trails.
Install Posted Maps
The research showed posted maps are missing on the park’s trails. The inclusion of posted maps at key decision points could help mitigate disorientation on the trails.
The complex intersection I observed in my field study is a perfect example of a location that would benefit from a posted map.
Install Additional Trail Markers
My findings show that missing trail markers are causing disorientation. These findings reveal that there are key decision points in the park that need trail markers installed.
The intersection I observed during my field study also revealed inconsistencies in trail markers locations. The red stars show existing trail markers while the red Xs represent key decision points that would improve navigation with the inclusion of trail markers.
Redesign Trail Markers
The research indicates that some trail markers are difficult to interpret and cause confusion. This shows that there are trail markers within the park that need to be redesigned. Establishing unique symbols for trails could be used as a quick reference so people wouldn’t necessarily need to read the signs


The current trail markers used by the City of Seattle. Mounted on a 6” post, the marker’s text and arrows are small, approximately 1” and 2” respectively. Larger signs would allow for easier reading and more information to be displayed.
Establishing unique symbols and identifying landmarks, like these examples from other park systems, could provide people with a more glanceable trail marker.
Project Presentation
Once the survey study was complete, I consolidated my research from all three studies into a final project presentation. This presentation served as a summary of the entire project and aimed to present my research question, approach, results, recommendations, and conclusions to an audience of peers and managers.
Reflection
After completing my research, I created a short PechaKucha style presentation. This presentation was an opportunity for me to reflect on the project and what I learned from utilizing the three research methodologies.